
Southwest Florida’s lifestyle, beaches, and the Island homes on the keys define the attraction of this region. Couple those elements with the culturally rich opportunities found in Sarasota and Manatee County you find a very appealing lifestyle.
While recent real estate market numbers reflect a reduction in activity and inventory, the overall market remains dynamic. As more baby boomers and buyers from outside markets move to the Suncoast, we will likely see a continuation and possibly even an increase in demand, while inventory will remain low.

Market Snapshot
The residential market numbers for our region reflect that it remains a seller’s market. Sale numbers for June, and the second quarter as a whole show that it is slowly moving towards a more balanced market; but overall, it remains a strong market despite higher mortgage rates and home prices.
The statistics for June show that average home prices in Sarasota and Manatee decreased somewhat to the same month in 2022. The median sale price for a single-family home in Sarasota County increased by 4.5% to $522,500. The median sale price in Manatee County decreased year-over-year by 4.5% to $525,000. The average days on the market in Sarasota County was 23 days, and Manatee County was 34 days – an increase for both counties compared to last year.

Housing Inventory
Today’s housing inventory remains below the previous normative level. The monthly Florida Stellar MLS data reflects a month’s supply of inventory for Sarasota County increased to 3.2-month supply. The month’s supply of inventory for Manatee County increased 2.8 -month supply from last year. The months of inventory at the end of second quarter shows an uptick from last year’s quarter. A balanced market is 6 months of supply, so anything below that shows a seller’s market.
The supply of homes for sale is still low
According to a recent report from Realtor.com: the average of active inventory in June stayed 50.6% below pre-pandemic 2017-2019 levels. The graph below uses historical data to provide a more specific look at how much the numbers still lag behind the level of inventory typical of a more normal market.
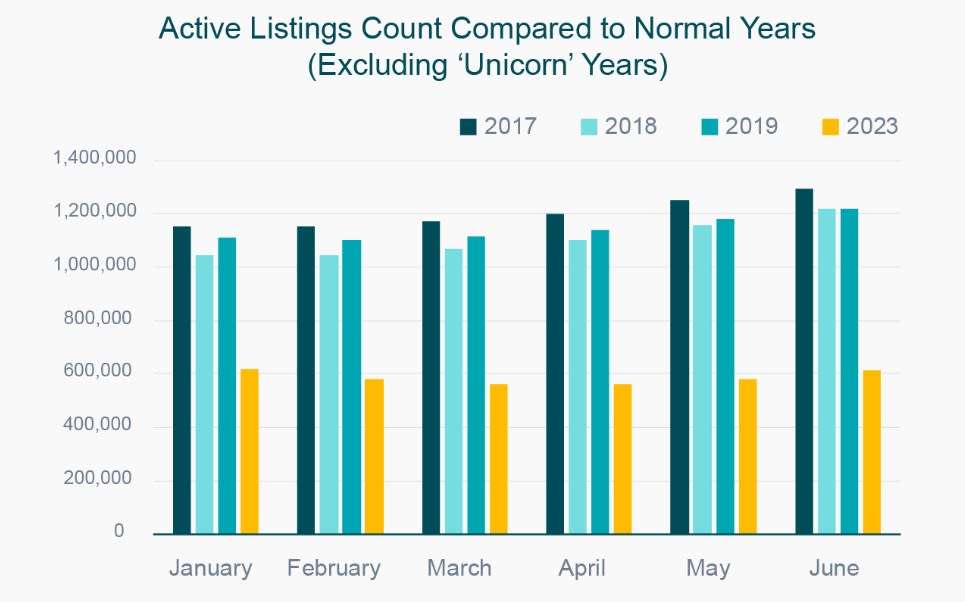
Of note, the graph excludes data from 2020-2022 due to truly abnormal years for the housing market. When you compare the orange bars for 2023 with the last normal years for the housing market (2017-2019), you can see the count of active listings is still far below the norm.
What does this mean for you?
If you’re thinking about selling your house, low inventory provides a strong incentive to list now. With fewer choices for buyers now than in more normal years, key statistics in the housing market reflect the impact for sellers, particularly the latest confidence index from the National Association of Realtors (NAR).
-
The percent of homes that sold in less than a month ticked up slightly.
-
The median days on market went down.
-
The average number of offers on recently sold homes went up.
With numerous variables both locally and nationally, making a conclusive prediction about the real estate market remains elusive. Yet, we do recognize that current pricing remains strong and buyers remain active.

If you are considering a move and would like to discuss detailed information about the market trends in your neighborhood, please contact me at 941.266.0529 or email me at [email protected]. I look forward to discussing your real estate goals with you.